What is reCaptcha?
reCaptcha is a service from Google designed to distinguish between human and automated access to websites. This helps protect your giveaway from spam by using advanced techniques to identify bots.
How do I enable reCaptcha?
- reCaptcha can be found on the integrations page.

- It is enabled automatically on every giveaway on every paid pricing plan. We suggest leaving this feature enabled in order to best protect your draw from spam entries from bots.
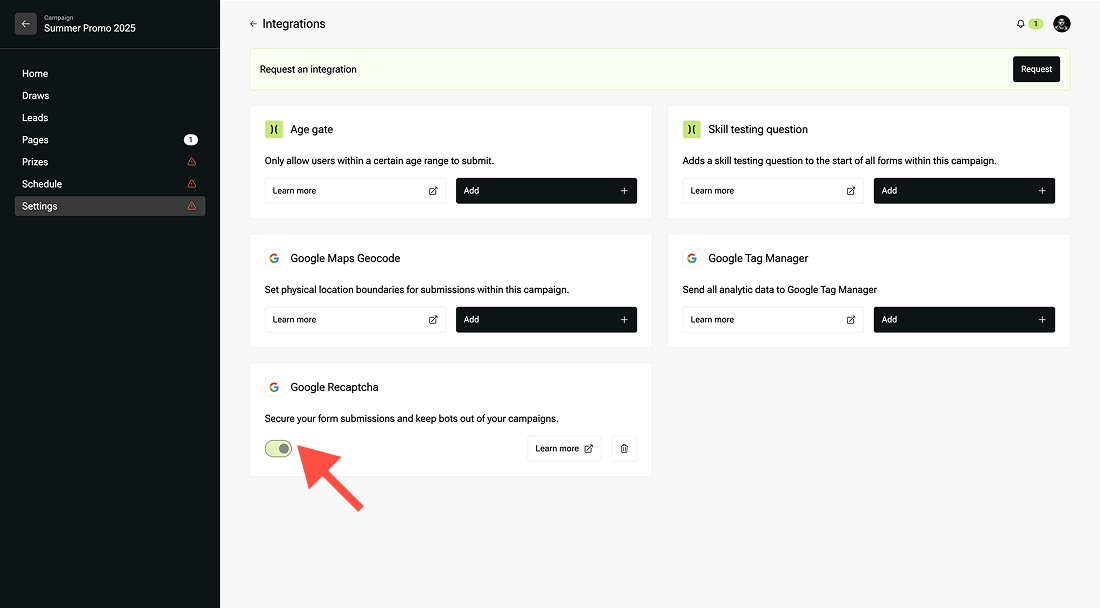
- You can ensure your reCaptcha is on and enabled by double checking the feature's settings on the integrations page within your campaign.
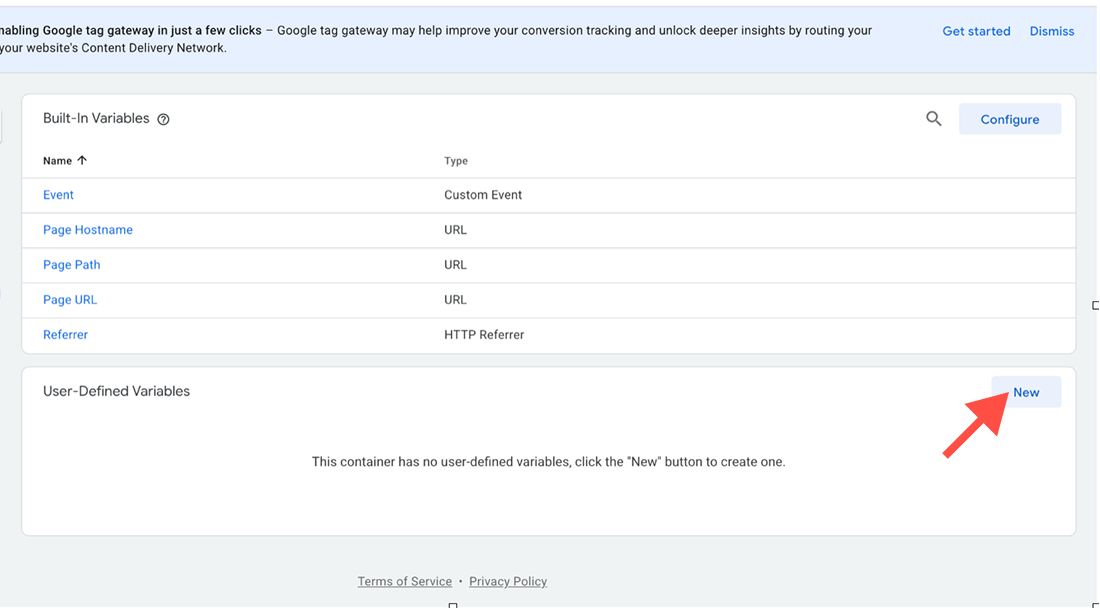
- riables section.
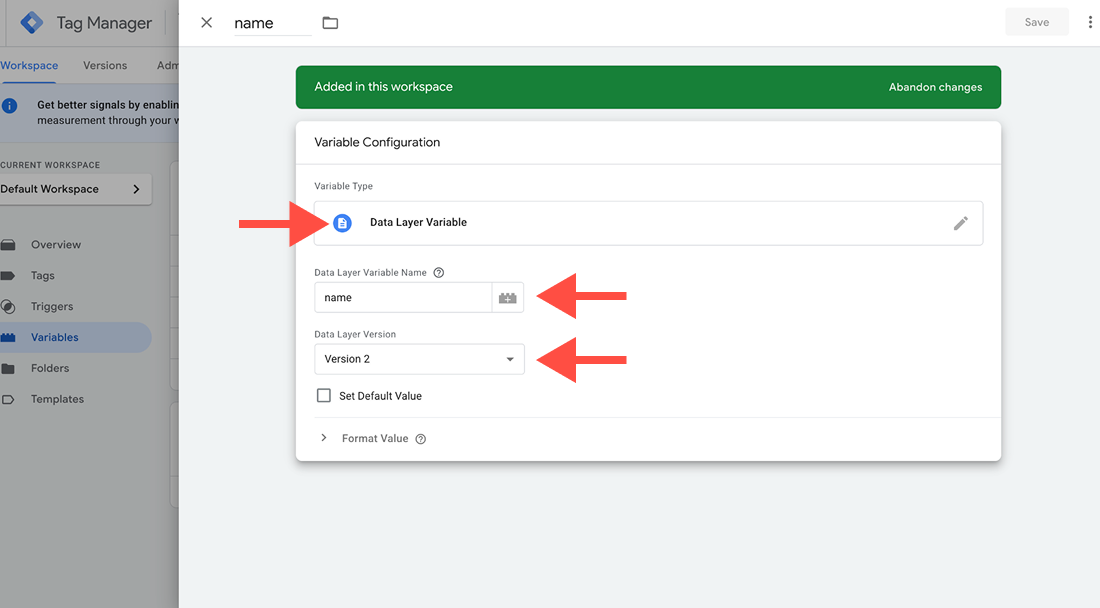
- Using the form that appears, configure your new variable. Set Variable Type to ‘Data Layer Variable’, set Data Layer Variable Name to the exact key of the custom variable being sent in through the data layer (in this case just name), and set Data Layer Version to Version 2
- Save the variable
Set Event Parameters
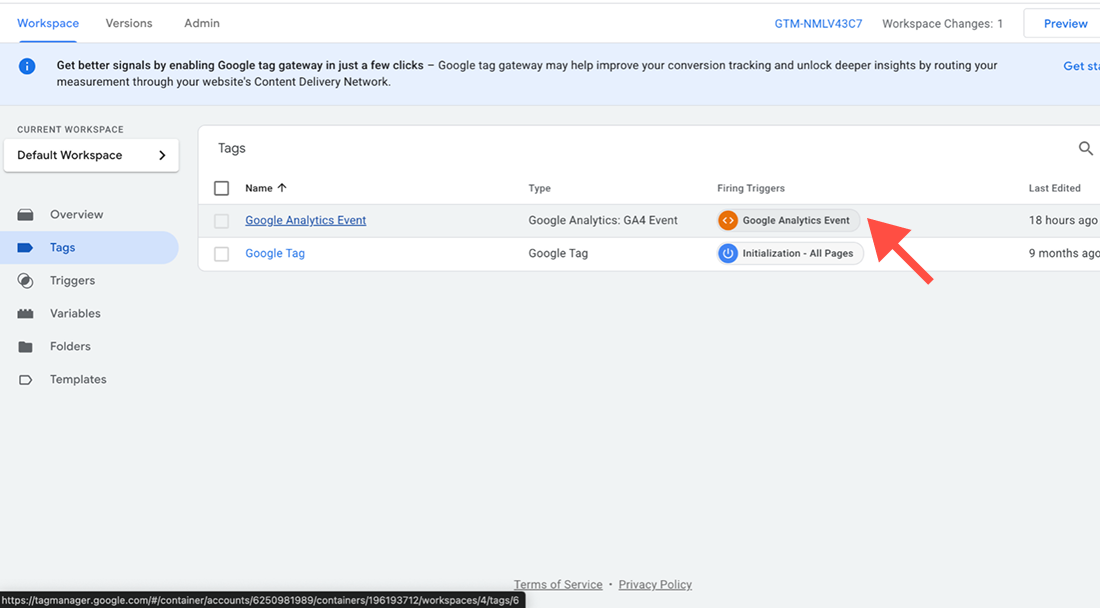
- Navigate to the tags tab in the GTM admin and click on your ‘Google Analytics Event’ tag.
- Click the ‘event parameters’ section within the tag settings, then click ‘Add Parameter’
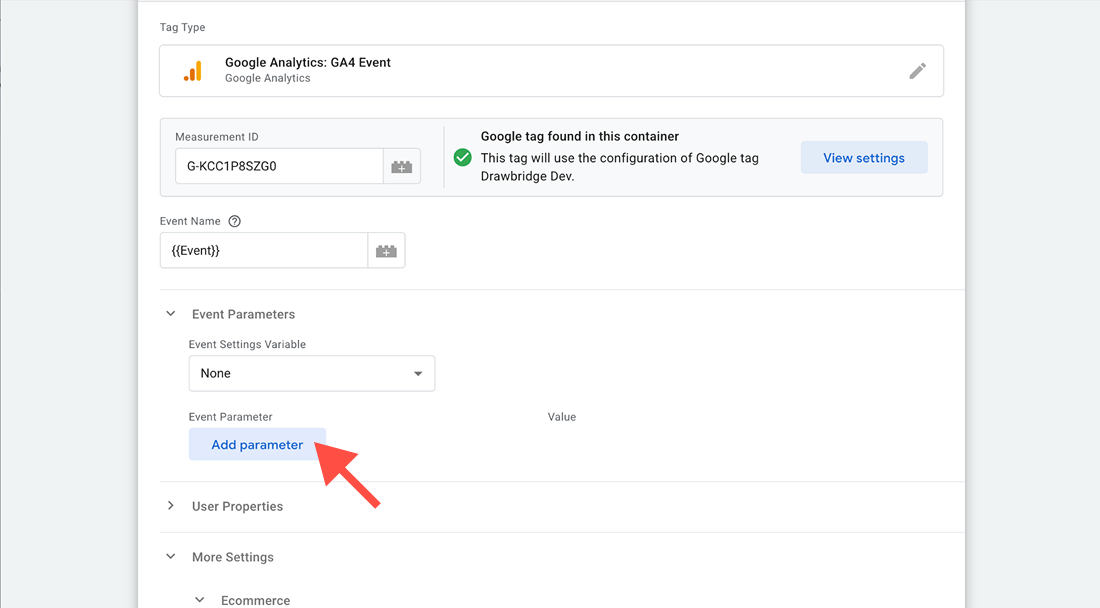
- Set the first input field that appears to match your data layer variable name (in this case just name). In the second input that appears, click the variable select button to the right of the input and then choose the variable you just created.
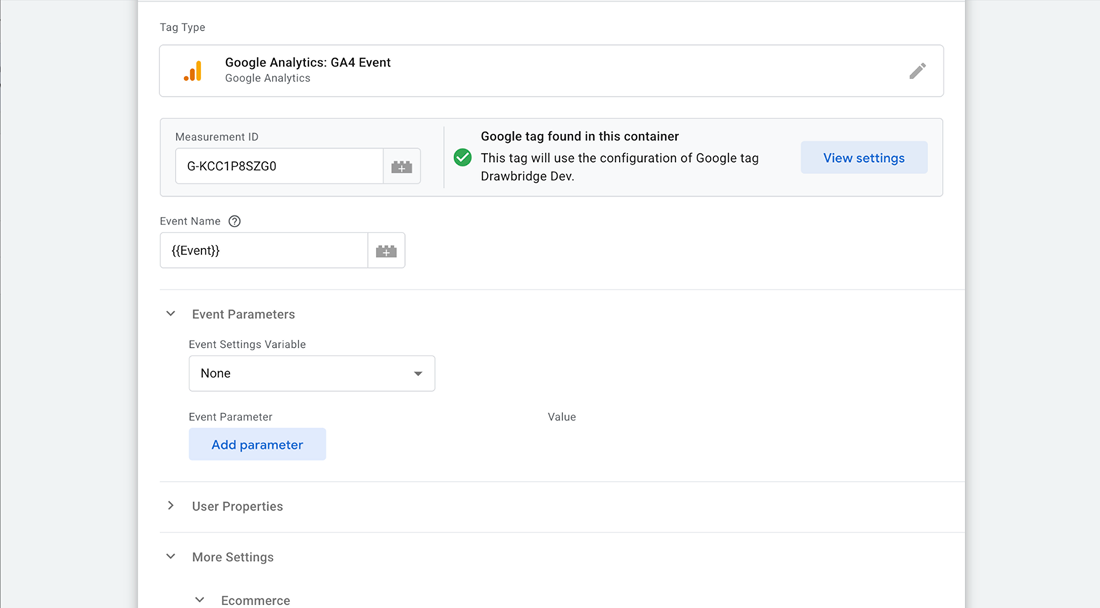
- Save your tag.
Configure Analytics Reports
- Navigate to Google Analytics and click the admin settings button in the bottom left corner of the screen.
- In the ‘Data Display’ section, click the ‘Custom Definitions' link

- Click ‘Create Custom Dimension’ and fill out the form. Set Dimension name to something descriptive, set scope to ‘Event’, and set Event Parameter to the name of your custom parameter (in this case name). If necessary, add a description of the property.

- You will now be able to see the value of the custom property for all future tracked events. You can do this in any report by clicking the blue + icon in the header, clicking custom in the dropdown that appears, and then clicking the parameter name you’re looking for. Please note, creating this dimension will not have the value appear for already tracked events. Only events tracked after the dimension is set up will have a value.
List of Custom Event Names
The following table outlines the custom events being tracked by the Drawbridge GA4 integration. The table includes the name and type of each event, as well as examples for events with dynamic names.
Event NameEvent Typeform-report-issuesubmitform-prize-[prize slug]submitbutton-confirmationclickform-lead-informationsubmitform-geocodesubmitform-age-gatesubmitform-skill-testsubmitbutton-enter-openclickbutton-menu-openclickbutton-enter-closeclickbutton-menu-closeclicklink-prizesclicklink-shareclicklink-[slug]clicklink-report-issueclicktab-[tab slug]clickprize-[prize slug]click
Creating Custom GA4 Reports
The following guide outlines the process of creating a custom report within GA4 for checking event data with a variety of custom dimensions. This specific guide will outline creating a report that shows event count by event name and subdomain/hostname
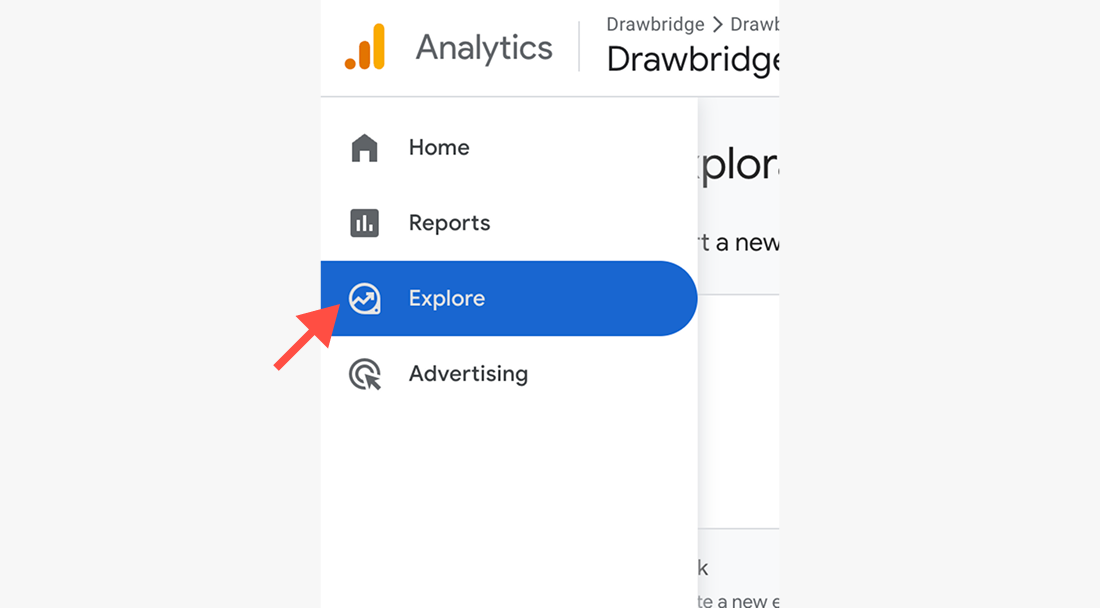
- In the left sidebar, click the explore tab
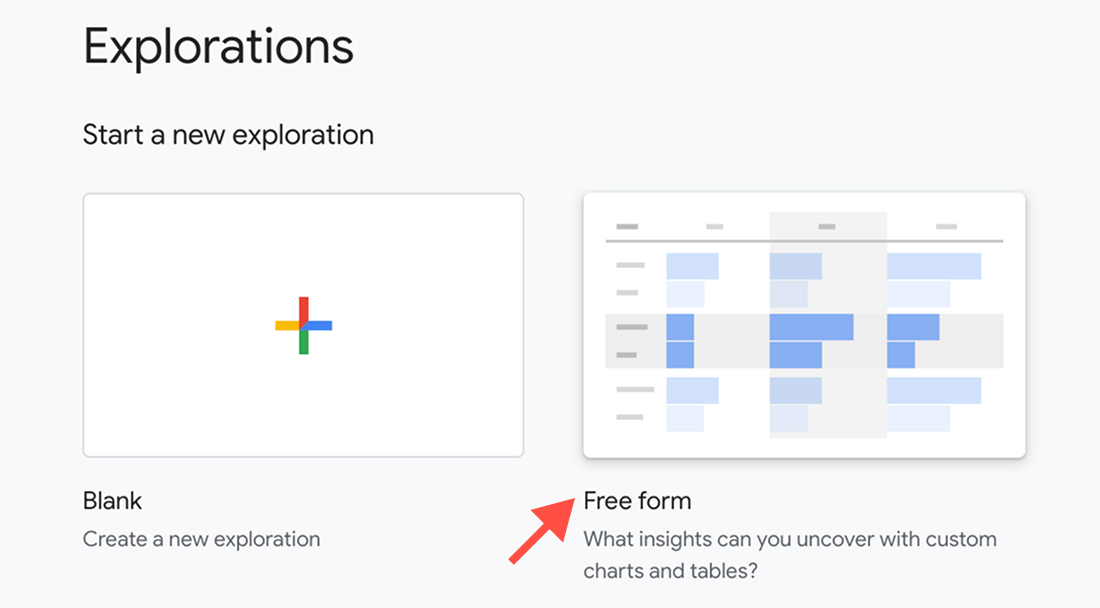
- Under ‘Start new exploration’, click the free form option
- In the variables column, scroll until you see the ‘Dimensions’ heading then click the plus icon to bring up the dimensions selection menu. Add the ‘name’ property under the ‘Custom’ heading and the ‘Hostname’ property under the ‘Page / screen’ heading. This will make these dimensions available for your report.'
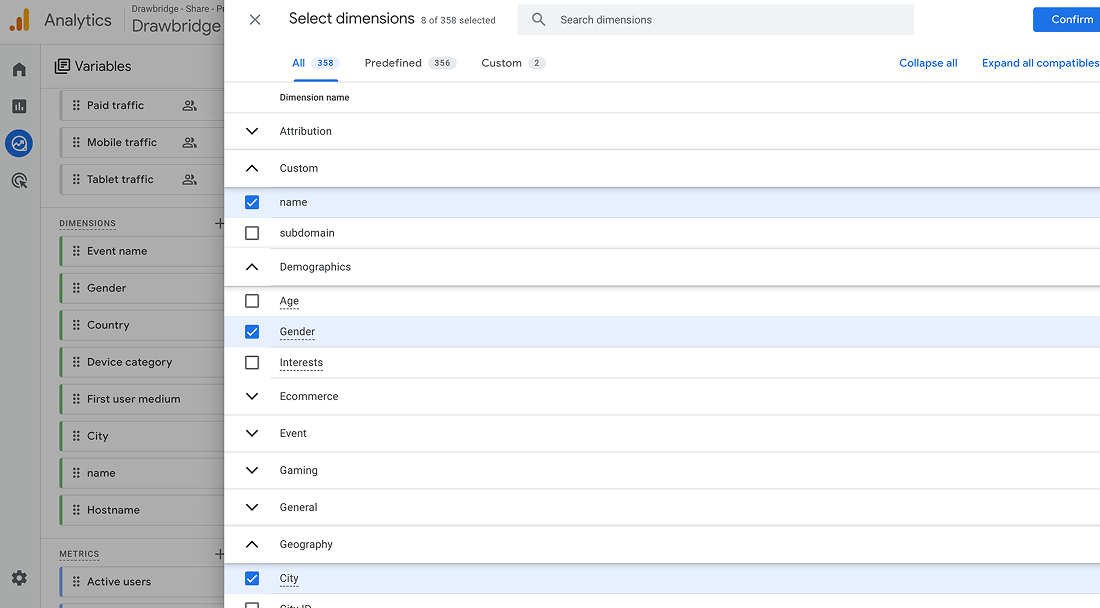
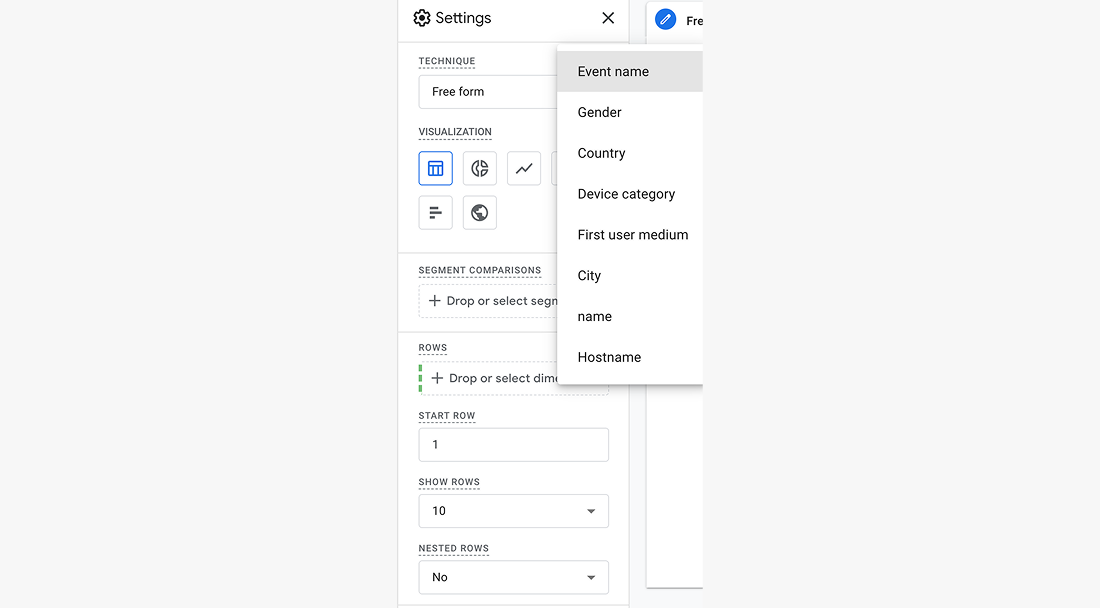
- In the settings column, add three rows (Event Count, name, and Hostname)
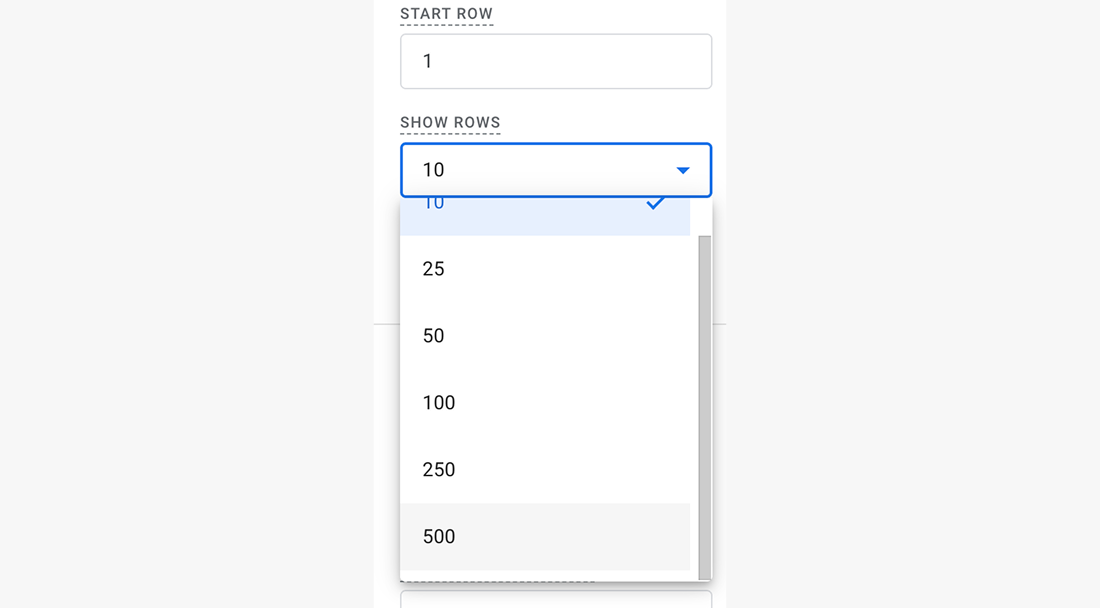
- Click the ‘show rows’ dropdown and set it to the desired amount (note: if this number is set too low, some events may now be shown.)
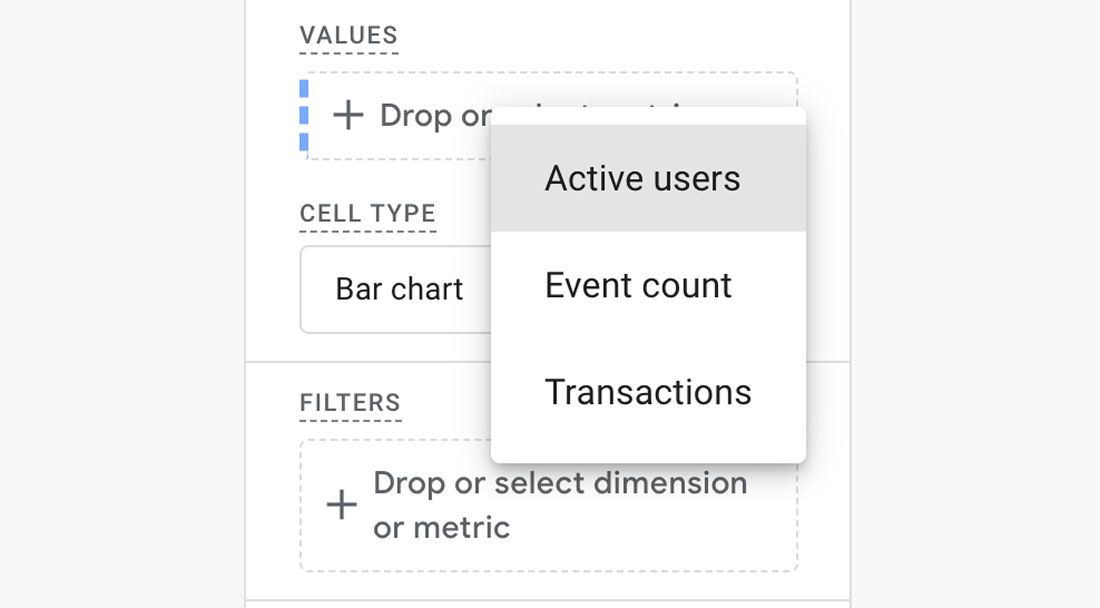
- Scroll to the ‘Values’ heading in the settings column and add ‘Event count’
- The report on the right side of the screen will now show you event counts by name and subdomain (Event name is the event type, name is the custom event name, and hostname is the subdomain the event fired on).
- The report can be further customized using the variables and settings tabs. For example, the range of data can be increased in the variables tab by clicking the date range listed at the top and changing it to whatever is necessary.
